Machine Learning

Linear Regression
Our first idea was to try and predict how many times a song charted based on Spotify metrics of songs, so we started looking for simple linear relationships between the number times charted, and each individual feature. As shown in the image "Number of Times Charted" graphs, there was not a clear linear relationship between any of the variables from the plots. So we decided that predicting streams might yield better results and started by checking their scatter plots. As the "Streams" plots show, none of the plots looked particularly promising. That was supported by the correlation heatmap of all variables, above. The highest positive correlation for Streams (besides itself) was Popularity, which had a r^2 of 0.14 that is in the middle of "None or very weak". The highest negative correlation for Streams was Highest Charting Position, with a r^2 of -0.3 that is on the edge of "very weak" and "weak".
At this point we determined that a different type of model was needed.
Number of Times Charted

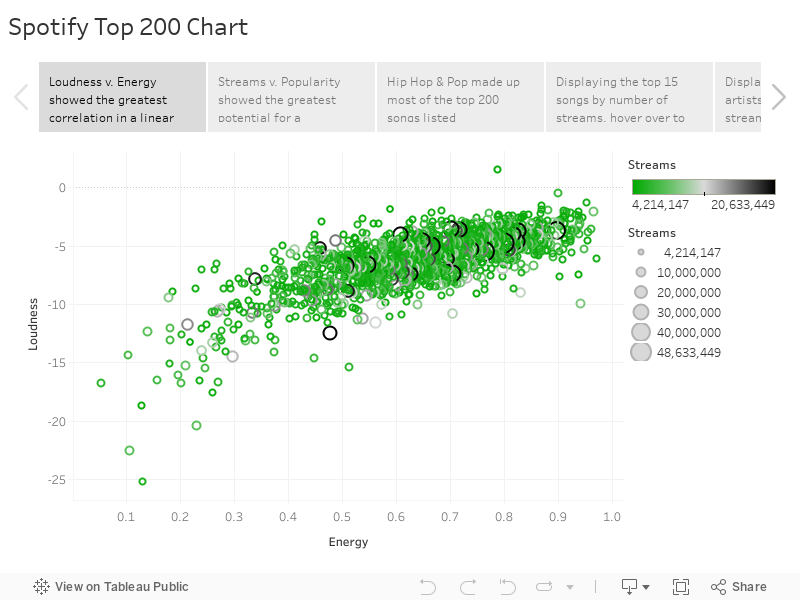
Streams

Random Forest Regression
Linear Regression models did not show any linear relationship between Streams and the Feature dataset. Random Forest Regression uses decision trees, averaging the sample data to improve predictive accuracy and control over-fitting. Our data was split into training and testing samples at a 75% and 25% split. The data was also cleaned by dropping more unnecessary columns and encoding the Genre category using LabelEncoder to change the values from Categories to integers. After the data was pre-processed, we ran the Random Forest Regression model using SciKit-Learn RandomForestRegressor. The number of trees in the forest (n_estimators) was set to 50. The model was also tested at 100 and 150 trees, but did not improve performance. This model showed our strongest accuracy with an R2 score of .83. This indicated that the model fit well with a score very close to 1.0. Our output also showed a strong similarity for Actual Streams and Predicted Streams. Therefore, we determined we could use this model to predict the number of Streams based on the data features.
Random Forest Regression Output